 SMBDashboard
Small Restaurant KPIs You Can Actually Collect
By Mark Fulton · 2026-08-26 · 15 min read
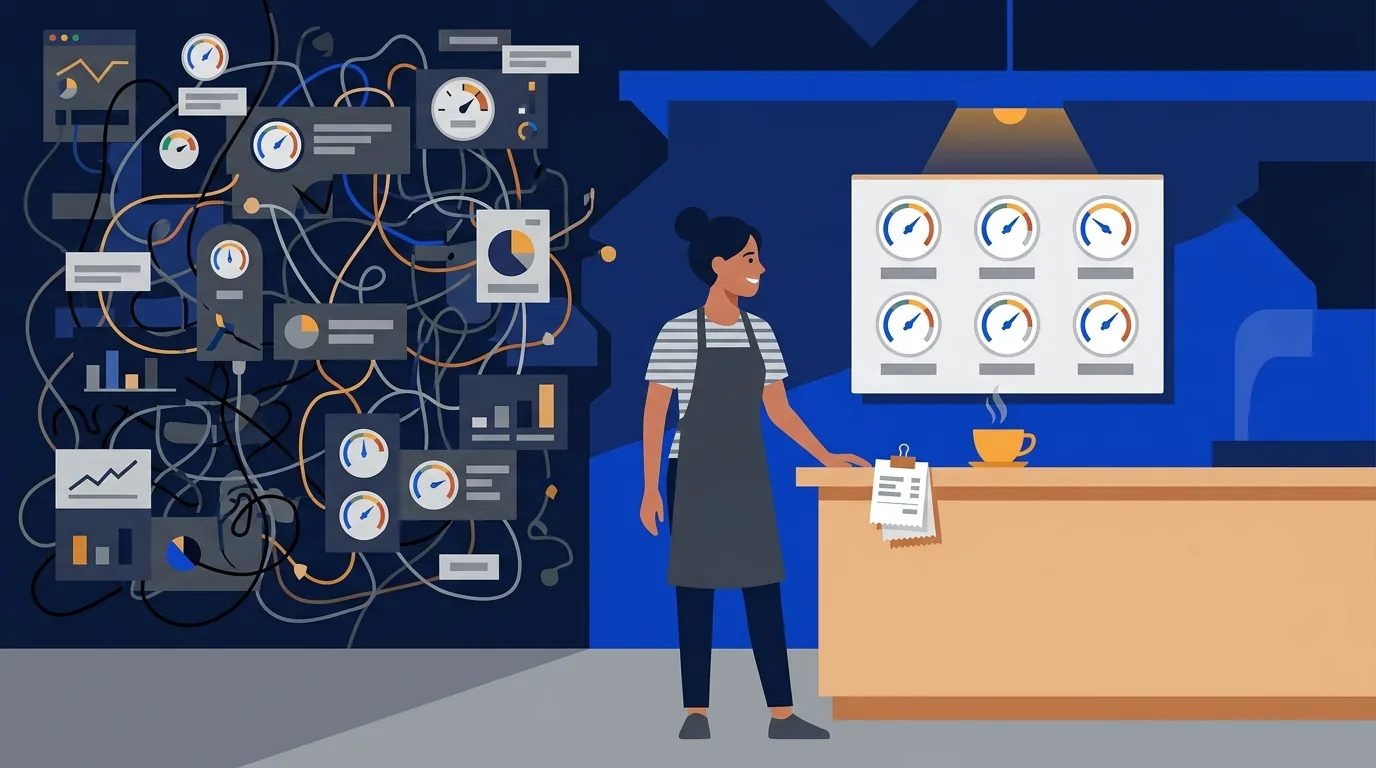
A single-site restaurant or café needs six numbers, not twenty-two: daily sales (the till total for the day), food cost percentage (food purchases adjusted for stock movement ÷ food sales), labour cost percentage (total wage cost including your own ÷ sales), average check (sales ÷ covers), covers by day of week (a tally, counted separately for each of the seven days), and waste (what you threw out, written down). Food cost plus labour cost is your prime cost, and at one site it is the number that decides the month. Every one of the six comes off a till reading, a stack of supplier invoices, a payroll run, and a notebook. None of them requires a POS integration, an inventory platform, or a finance function. The famous metrics that do require those things, revenue per available seat hour and table turnover chief among them, are safe to skip when you have twenty seats, and the reason is arithmetic rather than laziness.
The restaurant KPI lists in circulation are not written for you. They are written by companies that sell restaurant software, for the kind of operator who buys restaurant software: a group with several sites, a general manager at each, and someone in an office reconciling them. That reader has a POS that timestamps every table, an inventory system that values stock weekly, and a bookkeeper who closes a period. Handing that reader twenty-two metrics is reasonable, because the systems produce them for free.
Handing the same list to somebody running a twenty-seat café is not. There, every metric on the list is a task somebody has to do at eleven at night, and most of them are tasks that cannot be done at all without buying the thing the article is advertising.
So this is the small version. Which of the standard metrics survive at one site, what the arithmetic is for each, exactly where the raw figures come from when you have no software, and which famous ones you can drop without losing anything real.
Which restaurant KPIs need a POS and which don't?
This is the distinction the standard lists never draw, and it is the only one that matters when you are deciding what to do tomorrow morning. A metric is collectible for you if its inputs already exist somewhere in your day. It is not collectible if its inputs are timestamps that only a system can capture.
Here is the full standard list against the six-number version, with the collection requirement spelled out.
| Metric | On the standard list | In the six-number version | What you would need to collect it |
|---|---|---|---|
| Daily sales | Yes | Yes | The till total or the day's card settlement plus cash counted |
| Food cost percentage | Yes | Yes | Supplier invoices, plus a rough opening and closing stock count |
| Labour cost percentage | Yes | Yes | The payroll run, plus your own hours valued honestly |
| Prime cost | Yes | Yes | The two lines above, added together |
| Average check | Yes | Yes | Sales ÷ covers, both of which you already have |
| Covers by day of week | Partly, usually as one average | Yes, split by day | A tally sheet by the pass, one mark per cover |
| Waste | Yes | Yes | A notebook by the bin and the discipline to use it |
| Net profit margin | Yes | Monthly, not weekly | A full profit and loss including rent, utilities, insurance |
| Break-even point | Yes | Once a year, or after a price change | Fixed costs and gross margin |
| Revenue per available seat hour | Yes | Skip | Sales attributed to seats and hours, which needs POS timestamps |
| Table turnover / turn time | Yes | Skip | Seat and clear times per table, from a POS or host system |
| Inventory turnover ratio | Yes | Skip | Full valued stock counts at both ends of a period |
| Total sales by server | Yes | Skip | Per-server POS logins on every order |
| Order accuracy rate | Yes | Skip | Every remake and comp logged as a coded transaction |
| No-shows and cancellation rate | Yes | Skip unless you take bookings | A reservation system with a status per booking |
| Online reservation rate | Yes | Skip | A reservation platform |
| Customer satisfaction score | Yes | Skip | A survey tool and enough responses to mean something |
| Sales from online ordering | Yes | Only if you sell online | The platform's own dashboard, which already reports it |
Read down the right-hand column and the pattern is obvious. The metrics that survive are the ones whose inputs are money and headcount. The metrics that get skipped are the ones whose inputs are timestamps. Money and headcount you can capture with a pen. Timestamps you cannot, which is precisely why the software that captures them is what the articles are selling.
How do you calculate food cost percentage from invoices?
The textbook formula wants a cost of goods sold figure: opening stock, plus purchases, minus closing stock. That is correct, and at one site you can run it in about twenty minutes a week without valuing every jar in the building.
Food cost percentage = (opening stock + food purchases, minus closing stock) ÷ food sales × 100.
The three inputs, in the order of how hard they are to get:
Food purchases is the easy one and the reason this works at all. It is the total of your supplier invoices for the period, food only, drink kept separate. You already have these, because the IRS expects you to. Its guidance on business recordkeeping is that you may use any system that clearly shows income and expenses, and that purchases and other transactions generate supporting documents you need to record in your books. The invoices are not extra work. Adding them up is the only new step.
Food sales is your till total for the same period with drink stripped out, because drink runs at a completely different cost ratio and blending them produces a number that describes neither.
Stock movement is the input people abandon the exercise over, and they abandon it because they try to do it properly. You do not need a valued count of every item. You need a rough count of the six or eight things that tie up most of your money, usually proteins, cheese, and whatever your signature dish leans on, valued at the price on the most recent invoice. Do it at the same hour on the same day each week. The absolute value being slightly wrong matters far less than the method being identical week to week, because you are reading the direction of travel, not filing accounts.
If your stock level genuinely does not move much week to week, which is common in a café with a short menu and daily deliveries, you can skip the count entirely and treat purchases as your cost of goods. Say plainly to yourself that you are doing that, and do not switch back and forth, because a week where you counted compared against a week where you did not is not a comparison at all.
A word on the benchmarks. You will see food cost quoted at 30 to 40 percent, labour at 20 to 30 percent, and prime cost at under 60 to 65 percent, stated with the confidence of settled fact. Chase the citations and they lead to other software vendors' blog posts rather than to a survey with a disclosed sample, a year, and a method. Those bands may well be roughly right for some segment of the market. Nobody publishing them tells you which segment, how many restaurants were measured, or when. A fast-casual counter operation, a wine-led bistro, and a bakery have structurally different cost shapes, and one band cannot describe all three.
The usable version of the advice is qualitative and, unlike a number with no sample behind it, actually true: your own food cost percentage from eight weeks ago is a valid benchmark, and it is the only one you have that was definitely measured on your restaurant.
What is prime cost and why does it decide the month?
Prime cost is food and drink cost plus total labour cost, expressed as a percentage of sales. It is the one composite figure worth the effort at any size, and here is the reason.
Almost everything else on your profit and loss is fixed within the month. Rent does not move. Insurance does not move. Your loan payment does not move. The two lines that move every single day, that you can influence between now and Friday, are what you buy and who you roster. Prime cost is those two lines and nothing else.
That is also why the two have to be read together rather than separately. They trade against each other constantly, and the trade is invisible if you only look at one. Buying prepped vegetables pushes food cost up and labour down. Making stock in house pushes labour up and food cost down. Cutting a shift to fix a labour number that looked high can push waste and food cost up the following week, because nobody had time to use the produce properly. An owner watching food cost alone will make the wrong call about half the time. An owner watching prime cost will not, because prime cost nets the trade out.
Practical rule for a single site: track food cost and labour cost weekly, but judge yourself on prime cost monthly. Weekly food cost is noisy, because a big delivery lands in one week and gets sold across two. Four weeks of purchases against four weeks of sales smooths that out without waiting long enough for a bad trend to do real damage.
What does average check tell a small operator?
Average check is sales ÷ covers. Two figures you have. It is worth tracking because it is the fastest read on whether a change you made actually worked.
The reason it is more useful than raw sales is that sales move for two completely different reasons, and the difference determines what you do next. Sales can rise because more people came in, or because the same people spent more. Those call for opposite responses. More people means look at capacity, staffing, and the queue. More spend per head means the menu change, the specials board, or the upsell is landing, and you should do more of it.
Raw sales cannot tell you which happened. Average check and covers, read side by side, tell you immediately. If sales are up 8 percent and average check is flat, you got more people. If sales are up 8 percent and covers are flat, your average check did the work.
Two collection notes that make the number honest. Count covers as people served, not tables and not tickets, and be consistent, because a takeaway bag and a table of four are not the same event. And exclude tips, which are not your revenue.
Why is covers by day of week the most actionable line?
Because it is the only one of the six that changes what you do next week rather than explaining what happened last week.
The standard lists reduce this to a single "average covers" figure. Averaging across the week is exactly where the information goes. A café doing 340 covers a week is not doing 49 a day. It is doing 20 on Monday, 30 on Tuesday, and 90 on Saturday, and the average describes none of those days. Every decision you actually make is a decision about one specific day: who is on Thursday, how much fish to order for the weekend, whether Monday should open at all.
Keep it as a simple grid, seven columns, one row per week. A tally sheet by the pass and a mark per cover is enough. After six weeks the shape of your week is visible, and it is usually more lopsided than it feels from inside the service.
What it changes, concretely: rostering against the actual day rather than against a habit, ordering perishables against the day they will sell, and choosing which day to close or shorten if you need to claw back hours. That last one is a decision plenty of small operators put off for months because they have no evidence, and six weeks of a tally sheet is evidence.
What can a single site safely ignore?
Skipping a metric is not neglect when the metric cannot tell you anything at your scale. Here is the reasoning for each, so the decision is yours rather than mine.
Revenue per available seat hour measures yield on a fixed inventory of seat-hours. It exists because a large operator has to compare a busy site against a quiet one and needs to normalise for size. You have one site. You are not comparing anything, and the same information reaches you through covers by day of week without needing timestamped seat data.
Table turnover matters when there is a queue at the door and the question is whether to invest in speeding service. If you have no queue, faster turns produce nothing but emptier tables. Notice the direction of the logic: turnover is a lever you pull once demand exceeds capacity, so it is a metric for a problem you would already know you had.
Inventory turnover ratio needs valued stock counts at both ends of a period, which is the expensive half of the work you already avoided when you took the shortcut on food cost. It answers roughly the same question food cost percentage answers, at several times the cost.
Sales by server requires per-server POS logins. With two or three staff you already know who sells the specials.
Customer satisfaction score needs a survey tool and a response volume that a twenty-seat room will not produce. Your public reviews and the fact that you recognise most faces are better instruments at this size.
Two things that stay on the list but move to a slower clock. Net profit margin is a monthly number, because it needs rent and utilities allocated, and it belongs in a conversation with your bookkeeper. Break-even is an annual number, recalculated after a significant price change or a rent review.
That boundary is worth stating plainly. Everything in this post is operational arithmetic you run yourself on your own figures. How costs are classified for tax, what is deductible, when to recognise revenue, and which accounting method suits you are questions for a bookkeeper or an accountant, and the SBA's guidance on managing business finances covers choosing between cash and accrual accounting and deciding whether a bookkeeper or a CPA fits. Nothing here is tax or financial advice, and it is not a substitute for either.
Where to put the numbers
Six numbers do not need a platform. They need one place that is the same place every week, because the failure mode is not calculating wrong, it is calculating in a different notebook each time and having nothing to compare against.
A spreadsheet is genuinely enough, and if you already have one that you actually open, keep it. If you do not, SMBDashboard will hold it. Log the day's takings as one income entry and each supplier invoice as an expense entry with the category filled in, "Food", "Drink", "Labour", so the totals separate later. Then the weekly business report prints revenue, expenses, and profit for the week with the change against the prior week, on one page you can save as a PDF. Your food cost and labour cost percentages are one division each off those totals, which is about thirty seconds with the calculator on your phone.
Being straight about the fit: the free tier holds 25 customers and 200 money entries, with unlimited tasks. A restaurant logging one takings figure a day plus a handful of invoices will work through 200 entries in roughly three to four months, and Pro lifts that cap and adds CSV export, recurring entries for the bills that repeat, and your own name on the printed report. Your data stays in your browser unless you turn on Pro sync, which is off by default.
Two related reads if this is the shape of thing you are after: the six numbers to check every Monday for the general small-business version, and cleaning business KPIs or salon KPIs if you also run something that bills by the appointment.
One last piece of context for anyone who has been made to feel that a single site is a small case not worth proper measurement. According to the National Restaurant Association's industry statistics, 7 in 10 restaurants are single-unit operations. The single site is the normal case. It is only the software market that treats it as the exception.
Frequently asked questions
What is a good food cost percentage?
The honest answer is that the widely quoted bands, usually 30 to 40 percent, circulate without a disclosed sample, year, or method, and tracing the citations tends to lead to other vendors' blog posts rather than to research. They also flatten real differences: a bakery, a steakhouse, and a coffee shop have genuinely different cost structures, and no single band fits all three. Use your own figure from six or eight weeks ago as the comparison. It is the only benchmark you have that was definitely measured on your restaurant. What matters far more than hitting somebody else's number is that yours is stable and that you know why it moved when it moves.
How do I track restaurant labour cost without scheduling software?
Take the total of your payroll run for the period, add employer taxes and any agency cost, then add a realistic value for your own hours even though you are not paying yourself a wage for them. Divide by sales for the same period. The step people skip is costing their own labour, and skipping it makes the number useless, because it hides the fact that the business only works while you personally work sixty hours in it. If you want the detail without a system, a paper roster with actual start and finish times written on it, not planned ones, gives you hours by day, and hours by day is what you need to compare against covers by day.
What is prime cost in a restaurant?
Prime cost is your cost of goods sold, food and drink, plus your total labour cost including employer taxes, expressed as a percentage of sales. It is the sum of the only two major cost lines you can change between now and next week, which is why it is worth more attention than either one alone. Food cost and labour cost trade against each other constantly, so watching one in isolation leads to decisions that fix one line and quietly damage the other. Prime cost nets that trade out into a single figure.
How often should a small restaurant check its numbers?
Daily for sales, which takes seconds at close. Weekly for food cost, labour cost, average check, covers by day, and waste, which is about twenty to thirty minutes if the invoices are already in one place. Monthly for prime cost and net profit margin, because weekly food cost is distorted by delivery timing and four weeks smooths it out. Annually, or after a price change or rent review, for break-even. The weekly slot is the one that actually changes behaviour, so pick a fixed time, Monday morning before service is the usual choice, and treat it as an appointment rather than something to do when there is a gap. There never is a gap.